In my last post, I mentioned the PID effect, which significantly decreases photovoltaic arrays’ performance. Now, I want to show how PID can be diagnosed using a few different analysis methods.
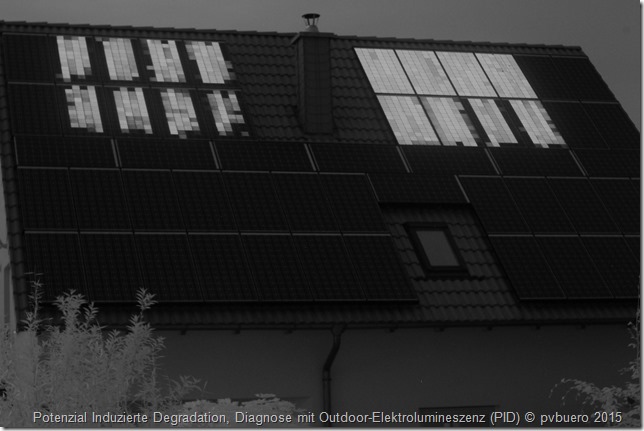
As discussed in my last post on this topic, outdoor electroluminescence analysis is the best way to detect the PID effect. This method lets you see the electroluminescence of all of a module string’s solar panels at the same time, making it easy to see the cells’ varying output levels. The picture below is a good example; the panels near the module string’s positive pole have a completely normal output, while those on the negative side have a much worse output, especially in the cells close to each panel’s frame. This evidence almost certainly points to PID.
conducted at night during the same site visit. Thermography only shows the heat distribution on a solar panel’s glass surface, while EL images give us a view through the glass to the cells.
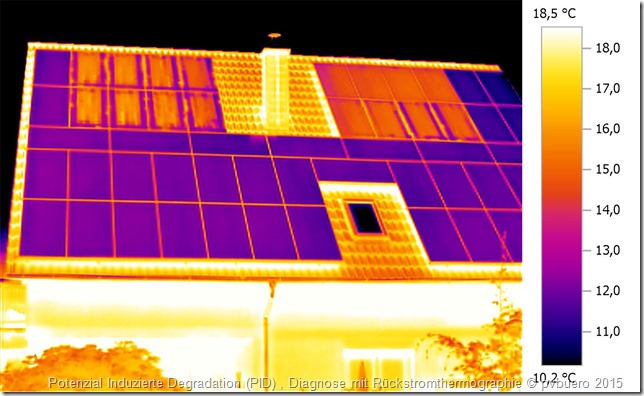
A thermal imaging camera can also reveal PID, as we can see in the thermogram of the same panel string below. However, it’s not quite as easy to confidently interpret the thermogram compared to the electroluminescence (EL) image. The method used here is reverse current thermography, As chance would have it, the last array where we detected PID had separate strings, with the central point of each string going to the utility room, where the inverter was located. We were therefore able to measure each part of the string separately – that is, the positive half and the negative half of the string. We took advantage of the opportunity and used the pvServe to send a defined reverse current of three amperes into both parts of the string. For the part of the string affected by PID (that is, the part with negative voltage between the solar cells and the ground), we needed 273 volts for eight panels connected in series, or 34.125 volts per panel, to do this. The eight panels on the positive end needed 348 volts, or 43.5 volts per panel for eight panels connected in series. With this case, we were able to clearly prove that PID can also be diagnosed based on the panel string’s dark I-V curve. The voltage needed to send three amperes of reverse current was 27 percent higher for the positive half of the string.
In the daytime, we also measured different open-circuit voltage figures for the two parts of the string. As you can see, there are a few different options for tracking down this phenomenon. The easiest and quickest option, though, is outdoor electroluminescence, since it shows all of a string’s panels in one image and lets you immediately see the different panels’ varying output levels.
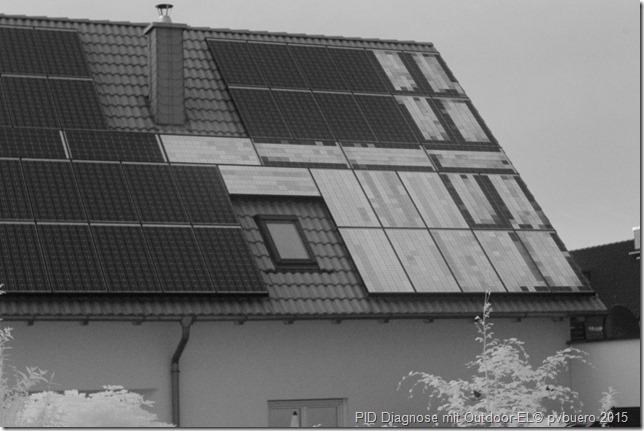
We took the EL images shown in this post with our pvServe and the pvVision set.
We would like to thank our customer for kindly letting us publish the images.